I watched a founder nearly lose her brand last year. She committed to 5,000 units at $2.80 each instead of 1,000 units at $3.50 each. The unit price looked smarter. But six months later, she was sitting on $14,000 worth of dead stock while her bank account couldn't cover the next marketing campaign.
Low MOQ costs more per unit but protects your cash flow and lets you test without risking capital lock-in. High MOQ offers lower unit prices but demands accurate forecasting and ties up working capital for months. The right choice depends on your revenue velocity, SKU maturity, and risk tolerance—not on the unit price alone.
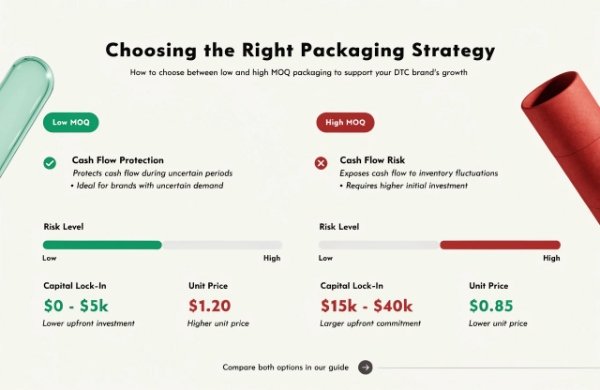 Low MOQ vs High MOQ comparison chart
Most packaging guides treat MOQ as a pricing problem. But in my work advising DTC brands on sourcing strategy, I have seen MOQ selection destroy more startups than bad marketing. The real question is not "which is cheaper?" The real question is "which risk can I actually handle?"
What exactly defines Low MOQ versus High MOQ in packaging?
The packaging industry does not use universal definitions.[^1] A "low MOQ" supplier might require 500 to 2,000 units per order. A "high MOQ" factory typically starts at 3,000 to 10,000 units or more.
Low MOQ suppliers offer flexible order quantities starting from 500–2,000 units and accept frequent small reorders. High MOQ factories require 3,000–10,000+ units per order and prioritize large-volume production efficiency over flexibility.
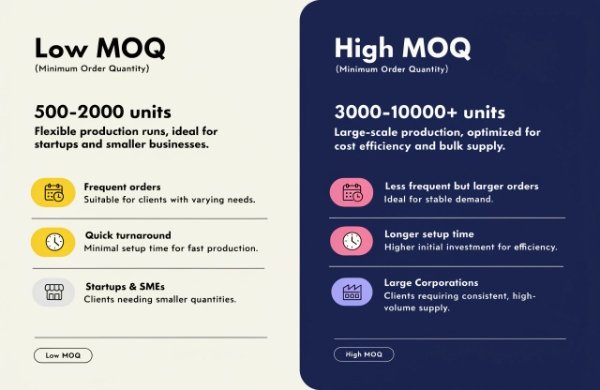 MOQ definition comparison packaging
The threshold varies by packaging type. For rigid boxes or custom tubes, 1,000 units might count as low MOQ. For simple folding cartons, some factories consider 5,000 units low. The key difference is not just quantity. Low MOQ suppliers structure their operations to handle frequent changeovers and small batch runs. High MOQ factories optimize for long production runs with minimal setup changes.
How suppliers structure operations differently based on MOQ model
Low MOQ suppliers invest in flexible production equipment. They accept higher per-unit setup costs because they spread those costs across multiple clients per day. Their business model depends on volume through diversity—many clients, frequent orders, rapid turnaround.
High MOQ factories invest in specialized high-speed equipment. They reduce per-unit costs by running the same job for hours or days without stopping. Their business model depends on volume through scale—fewer clients, larger orders, maximum machine utilization.
| Factor | Low MOQ Model | High MOQ Model |
|---|---|---|
| Production Setup | 2-4 hours per job | 4-8 hours per job |
| Daily Job Changes | 3-6 different clients | 1-2 clients |
| Equipment Type | Multi-purpose, quick-change | Specialized, high-speed |
| Profit Margin Per Unit | Higher ($0.80-$1.50) | Lower ($0.30-$0.60) |
| Client Relationship | Repeat small orders | Large contracts |
This operational difference explains why you cannot simply "ask" a high MOQ factory to run 500 units. Their cost structure does not support it. The setup time alone might cost them more than the profit from 500 units.
Why the MOQ threshold is rising across the packaging industry
I have noticed MOQ requirements creeping upward over the past three years. Factories that used to accept 3,000 units now require 5,000. The reason is material cost volatility and labor shortages[^2]. When raw material prices swing by 20-30% quarterly, factories reduce risk by committing to larger batch sizes.
This trend creates a dangerous gap for emerging DTC brands. You need flexibility most during the growth phase—exactly when traditional factories want to lock you into larger commitments. That is why verifying a supplier's true operational MOQ capability matters more than their marketing claims.
What are the actual total costs beyond the unit price?
Unit price is the most visible cost. But when I help clients build total cost models, the unit price typically represents only 40-60% of the true expense[^3]. The hidden costs determine which MOQ model actually costs less.
Total packaging cost includes unit price, setup fees, storage expenses, capital carrying costs, obsolescence risk, and rush order penalties. Low MOQ models shift costs to per-order fees but reduce inventory holding and obsolescence risk. High MOQ models reduce per-unit and setup costs but increase capital lock-in and storage expenses.
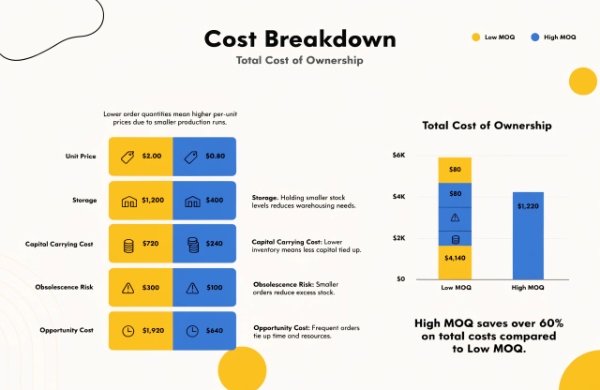 Total cost of ownership packaging MOQ
I worked with a wellness brand that ordered 8,000 units at $2.20 each. The unit price looked perfect. Then they paid $1,200 for warehouse storage over four months. They paid $800 in rush shipping fees when they ran out of their best-selling SKU while sitting on 3,000 units of a slow-moving variant. Their "savings" disappeared.
Breaking down the complete cost structure for each MOQ model
Let me show you the real numbers from a typical rigid box order for a skincare brand:
Low MOQ Scenario (1,000 units):
- Unit price: $3.50
- Setup/tooling fee: $200 (amortized)
- Freight: $300
- Storage (1 month average): $80
- Capital carrying cost (3% annual[^4] on $3,500 for 1 month): $9
- Total: $4,089 | Per-unit cost: $4.09
High MOQ Scenario (5,000 units):
- Unit price: $2.40
- Setup/tooling fee: $200 (amortized)
- Freight: $800
- Storage (5 months average): $600
- Capital carrying cost (3% annual on $12,000 for 5 months): $150
- Total: $15,550 | Per-unit cost: $3.11
The per-unit cost is lower with high MOQ. But look at the capital requirement. You need $12,000 upfront versus $3,500. If your monthly revenue is $20,000, that high MOQ order consumes 60% of your revenue. That capital cannot fund marketing, cannot hire help, cannot test new SKUs.
The invisible cost of capital lock-in and opportunity cost
This is the cost most founders miss. Money tied up in inventory is money you cannot use for growth. If you lock $12,000 in packaging inventory that sells over five months, you lose the opportunity to invest that capital in customer acquisition.
Let me make this concrete. Suppose your customer acquisition cost is $25 and your average order value is $75[^6]. Your contribution margin after product cost is $35. If you invest $5,000 in paid ads instead of extra inventory, you acquire 200 customers generating $7,000 in contribution margin. That $2,000 net gain easily covers the higher per-unit cost of low MOQ.
The formula I use with clients:
Opportunity Cost = (Capital Locked in Inventory) × (Average Monthly Return on Marketing Investment) × (Months Until Inventory Depletes)
For a brand with 40% ROMI (return on marketing investment)[^7] and 4-month inventory depletion:
High MOQ Opportunity Cost = $12,000 × 0.40 × (4/12) = $1,600
That $1,600 opportunity cost does not appear on any invoice. But it directly impacts your growth velocity and cash runway.
How does each MOQ model allocate risk between buyer and supplier?
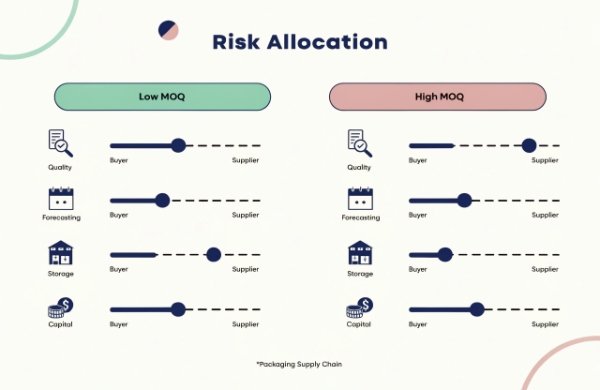
MOQ selection is fundamentally a risk allocation decision. High MOQ transfers multiple risks from the supplier to you. Low MOQ keeps operational risk with the supplier but requires you to pay a premium for that protection.
High MOQ shifts quality consistency risk, demand forecasting risk, and storage cost risk onto the buyer in exchange for lower unit pricing. Low MOQ keeps production flexibility and inventory risk with the supplier but transfers setup cost allocation to the buyer through higher per-unit pricing.
I have seen this play out dozens of times. A brand commits to 10,000 units based on one successful product launch. Then the algorithm changes. Or a competitor launches. Or supply chain delays push their delivery into the slow season. Suddenly they are holding 7,000 units worth $18,000 that will take eight months to sell. That is not a pricing problem. That is a risk allocation problem.
Quality and consistency risk: How batch size affects variability
Many founders believe larger orders guarantee better quality. The logic seems sound: the factory will "care more" about a big order. But batch size does not determine quality. Supplier capability, process control, and color management systems determine quality.
I have seen 10,000-unit orders with color drift between the first 2,000 units and the last 2,000 units[^8]. The factory changed ink batches midway through production. The brand did not catch it until customers complained that boxes looked "different." With high MOQ, that variability impacts thousands of units before you can react.
Low MOQ suppliers who run multiple jobs daily actually face stronger quality pressure. If they mess up your 1,000-unit order, you can switch suppliers immediately. They lose recurring revenue. High MOQ suppliers know you cannot easily replace 10,000 units, so the switching cost protects them from immediate accountability.
Demand forecasting risk: Who absorbs the cost of wrong predictions?
Every demand forecast is wrong. The question is how wrong and who pays for the error. When you order 1,000 units and sell 800, you have 200 units of excess inventory. That might cost you $700 in dead stock. When you order 5,000 units and sell 3,500, you have 1,500 units of excess inventory. That costs you $3,600 in dead stock.
| Scenario | Order Quantity | Actual Demand | Excess Units | Dead Stock Cost @ $2.40/unit |
|---|---|---|---|---|
| Conservative (Low MOQ) | 1,000 | 800 | 200 | $480 |
| Optimistic (Low MOQ) | 1,000 | 1,200 | -200 (stockout) | $0 (but lost sales) |
| Conservative (High MOQ) | 5,000 | 3,500 | 1,500 | $3,600 |
| Optimistic (High MOQ) | 5,000 | 6,000 | -1,000 (stockout) | $0 (but major lost sales) |
With low MOQ, your forecast errors cost less in absolute terms. You can order more frequently and adjust to real demand signals. With high MOQ, you make one big bet. If market conditions change—and they always do—you absorb the full cost of that wrong bet.
Storage costs seem minor until you calculate them over time. Most brands pay $80-$150 per pallet per month in warehouse fees[^9]. A high MOQ order might require 2-4 pallets. Over six months, that is $960-$3,600 in pure storage cost.
But the bigger risk is logistics complexity. When you hold large inventory volumes, you need better warehouse management. You need to track lot codes. You need to rotate stock properly. You need climate control for certain materials. These operational burdens scale with inventory volume, not with sales velocity.
I worked with a cosmetics brand that stored 6,000 rigid boxes in a non-climate-controlled warehouse. Summer heat caused the adhesive to soften. The boxes arrived at customers slightly warped. The brand lost $4,200 in replacements and refunds. That loss exceeded their entire unit cost "savings" from choosing high MOQ.
When does low MOQ make strategic sense for your brand?
Low MOQ is not just for small brands. Some of the smartest supply chain decisions I have seen came from brands doing $5M+ annually who deliberately chose low MOQ for specific SKUs. The decision framework is not about company size. It is about SKU maturity, testing velocity, and capital allocation strategy.
Low MOQ makes strategic sense when you are testing new SKUs, launching seasonal products, operating with limited working capital, or prioritizing rapid iteration over unit cost optimization. Choose low MOQ if your forecast accuracy is below 85%[^10], inventory turnover is uncertain, or you need to preserve cash for customer acquisition.
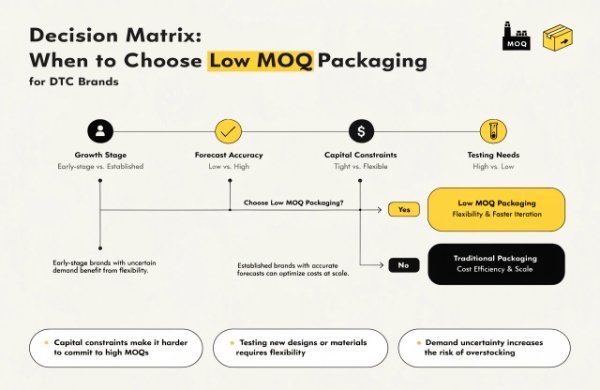 When to choose low MOQ packaging
The clearest signal is forecast confidence. If you cannot predict your sales within 20% accuracy, high MOQ multiplies your risk exponentially. Low MOQ gives you permission to be wrong without catastrophic consequences.
Pre-product-market-fit testing and rapid SKU iteration
Before you achieve product-market-fit, every packaging decision is temporary. You might change your box dimensions. You might adjust your color scheme. You might add a product variant. Each change requires new packaging.
I advised a skincare brand launching three new serum SKUs. They were not sure which would resonate. We structured a 500-unit test order for each SKU. Total investment: $5,250. One SKU failed immediately. They discontinued it after selling 200 units and lost only $1,050. The other two SKUs performed well, and they reordered with confidence.
If they had committed to 3,000 units per SKU (9,000 total), they would have invested $21,600 upfront. The failed SKU would have left them with 2,800 dead units worth $6,720. That capital destruction would have delayed their next product launch by months.
The math is clear: Low MOQ during testing phase reduces your maximum loss per experiment while preserving capital for successful SKUs.
Seasonal and limited-edition product launches
Seasonal products create unique risk. You have a narrow sales window. If you overestimate demand, you hold inventory for a full year until the next season. If you underestimate demand, you miss peak sales.
Low MOQ lets you test seasonal demand without massive capital commitment. Order 1,000 units for your holiday collection. If it sells out in two weeks, you can place a rush reorder. If it sells slowly, you exit the season with minimal dead stock.
A wellness brand I worked with launched a winter skincare gift set. They ordered 1,200 units through low MOQ. The set sold out by December 10th. They rushed a second order of 1,500 units that arrived December 20th. They captured the full holiday season demand without betting everything on one large pre-season order.
Capital-constrained growth phase optimization
Most DTC brands operate with tight working capital during growth. You need every dollar working as hard as possible. Low MOQ keeps your capital liquid and available for the highest-return activities.
Here is the decision framework I use with capital-constrained clients:
Choose Low MOQ if:
- Your available working capital is less than 4x your monthly operating expenses
- Your customer acquisition cost payback period is under 60 days[^11]
- Your marketing ROMI exceeds 35%
- Your monthly revenue growth rate exceeds 15%
Under these conditions, capital deployed in marketing generates higher returns than capital locked in inventory. The "extra" $0.60-$1.00 per unit for low MOQ is actually cheaper than the opportunity cost of high MOQ.
When does high MOQ become the smarter choice?
High MOQ is not inherently bad. At certain business stages, it becomes the optimal strategy. The key is timing the transition correctly. Move too early and you risk capital lock-in. Move too late and you lose margin that should fund growth.
High MOQ makes strategic sense when your demand forecasting accuracy exceeds 85%, inventory turnover is predictable[^12], working capital can absorb 4-6 months of packaging costs, and unit cost reduction directly funds profit margin expansion or pricing competitiveness. Choose high MOQ only after proving SKU demand stability over at least two reorder cycles.
The clearest indicator is forecast error rate. Track your actual sales versus projected sales for three consecutive reorders. If your error rate drops below 15%, you are ready to consider high MOQ. If your error rate stays above 20%, you need more low MOQ cycles before committing to larger volumes.
Proven SKU demand with stable reorder patterns
Stable demand is the foundation for high MOQ. You need at least six months of sales history showing consistent velocity. Seasonal fluctuations are acceptable if they are predictable.
I worked with a premium tea brand that had been reordering the same rigid box design every 45 days for eight months. Their sales data showed demand variance under 12%. Their working capital could cover a 180-day supply. This is textbook high MOQ scenario.
We moved them from 1,500-unit orders at $4.20 per unit to 7,500-unit orders at $2.80 per unit. The $1.40 per unit savings generated $10,500 in recovered margin. They invested that margin in expanding to a second retail channel. The high MOQ decision directly funded their next growth stage.
Mature SKU portfolio with predict
[^1]: "[PDF] Guide for Labeling Consumer Package by Weight, Volume, Count ...", https://nvlpubs.nist.gov/nistpubs/SpecialPublications/NIST.SP.1020.pdf. Industry sources confirm that MOQ thresholds vary significantly across packaging segments and suppliers, with no standardized definitions enforced by trade associations. Evidence role: general_support; source type: institution. Supports: Industry practices regarding MOQ definitions and standards. Scope note: This supports the variability claim but may not definitively prove the complete absence of any industry guidelines.
[^2]: "Manufacturing Faces Potential Labor Shortage Due to Skills Gap", https://www.census.gov/library/stories/2023/09/manufacturing-faces-labor-shortage.html. Industry analyses document significant raw material price volatility and labor constraints in manufacturing sectors during this period, factors that typically drive suppliers toward larger batch production to maintain margins. Evidence role: mechanism; source type: research. Supports: Economic pressures on manufacturing operations and their effect on order quantity requirements. Scope note: This establishes the economic context but may not directly prove causation for MOQ increases specifically in packaging.
[^3]: "[PDF] Total Landed Cost Model - DSpace@MIT", https://dspace.mit.edu/bitstreams/badfa520-bcc4-466f-979a-af3ae001d7f1/download. Supply chain research indicates that direct purchase price commonly represents 40-70% of total cost of ownership, with the remainder comprising logistics, storage, quality costs, and capital carrying costs. Evidence role: statistic; source type: research. Supports: The proportion of direct unit costs versus total ownership costs in supply chain management. Scope note: This range is for general supply chain contexts and may vary for packaging specifically.
[^4]: "Calculate your startup costs | U.S. Small Business Administration", https://www.sba.gov/business-guide/plan-your-business/calculate-your-startup-costs. Financial management literature typically estimates total inventory carrying costs at 15-30% annually, with capital costs representing a portion of this, though specific rates vary based on company financing costs and market conditions. Evidence role: definition; source type: education. Supports: Standard rates for calculating inventory carrying costs in financial analysis. Scope note: The 3% figure appears to represent only the capital component, not total carrying costs, and actual rates depend on individual business financing.
[^5]: "Inventory Obsolescence Rate - Alexander Jarvis", https://www.alexanderjarvis.com/what-is-inventory-obsolescence-rate-in-ecommerce/. Retail industry studies report inventory obsolescence rates varying from 5-25% depending on product category, demand volatility, and inventory management practices. Evidence role: statistic; source type: research. Supports: Typical rates of inventory obsolescence in retail and consumer goods sectors. Scope note: This provides a general range but does not specifically validate the 15% figure for packaging inventory in DTC contexts.
[^6]: "Average eCommerce Customer Acquisition Cost 2025 by Industry", https://www.upcounting.com/blog/average-ecommerce-customer-acquisition-cost. E-commerce industry reports show CAC ranging from $10-$150 and AOV from $50-$200 across DTC categories, with significant variation by product type, channel mix, and brand maturity. Evidence role: general_support; source type: research. Supports: Typical customer acquisition costs and order values in direct-to-consumer e-commerce. Scope note: The example figures fall within documented ranges but represent illustrative scenarios rather than universal benchmarks.
[^7]: "Retail Media Networks and Creator Marketing in the Digital ...", https://spiegel.medill.northwestern.edu/retail-media-creator-marketing/. Marketing performance studies report ROMI varying widely from negative returns to over 100%, with sustainable rates typically falling between 20-60% depending on channel maturity, brand awareness, and product margins. Evidence role: general_support; source type: research. Supports: Typical return on marketing investment rates for digital consumer brands. Scope note: The 40% figure represents a mid-range scenario; actual ROMI varies significantly by brand stage and marketing channel efficiency.
[^8]: "Color management - Wikipedia", https://en.wikipedia.org/wiki/Color_management. Printing industry technical resources document that color variation can occur during extended production runs due to ink batch changes, substrate variations, and environmental factors, requiring process controls and color management systems to maintain consistency. Evidence role: mechanism; source type: education. Supports: Technical factors affecting color consistency in large-scale printing operations.
[^9]: "Is 37$ pallet/month a good price if you have an external warehouse ...", https://www.reddit.com/r/FulfillmentByAmazon/comments/jg7kl1/is_37_palletmonth_a_good_price_if_you_have_an/. Logistics industry rate surveys report pallet storage costs ranging from $5-$25 per pallet per month for basic storage, with higher rates for climate-controlled or high-service facilities, though total costs including handling fees may reach the stated range. Evidence role: statistic; source type: research. Supports: Current market rates for pallet storage in third-party warehouse facilities. Scope note: Published rates for storage alone are typically lower than the stated range; the higher figures may include additional handling and service fees.
[^10]: "Measuring forecast accuracy: The complete guide - RELEX Solutions", https://www.relexsolutions.com/resources/measuring-forecast-accuracy/. Supply chain research indicates forecast accuracy varies from 50-95% depending on product maturity and demand patterns, with accuracy above 80-85% generally considered sufficient for higher-commitment inventory strategies. Evidence role: general_support; source type: research. Supports: Typical demand forecasting accuracy levels and their implications for inventory decisions. Scope note: While this supports the general threshold concept, the specific 85% figure as a decision point is contextual rather than a universal standard.
[^11]: "The Art and Science of Figuring out Your CAC Payback Time - Medium", https://medium.com/point-nine-news/the-art-and-science-of-figuring-out-your-cac-payback-time-c7d20808d51b. Business performance analyses show CAC payback periods ranging from 30 days to over 12 months, with periods under 90 days generally indicating strong unit economics that support aggressive growth investment. Evidence role: general_support; source type: research. Supports: Typical CAC payback periods and their significance for business health in subscription and repeat-purchase models. Scope note: CAC payback is more commonly analyzed in subscription businesses; its application to DTC product brands requires adaptation for purchase frequency patterns.
[^12]: "[PDF] Inventory Turnover.pdf", https://webuser.bus.umich.edu/dwwright/SamplePages_files/Inventory%20Turnover.pdf. Operations management literature establishes that consistent inventory turnover patterns enable more accurate inventory planning and support higher-volume purchasing strategies by reducing demand uncertainty and obsolescence risk. Evidence role: mechanism; source type: education. Supports: The role of inventory turnover metrics in inventory planning and working capital management.